Affiliate Marketing Growth and ROI in 2026
Global Market Valuation and Growth Trajectories
The global affiliate marketing sector has completed a structural transition from a supplementary digital acquisition tactic to a primary pillar of enterprise performance marketing. In 2026, the industry is characterized by unprecedented market depth, sophisticated attribution infrastructure, and a continuous reallocation of capital away from traditional impression-based media toward outcome-based channels. Global affiliate marketing expenditure reached an estimated $19.4 billion in 2026, demonstrating substantial growth from $17.1 billion in 2025, and is projected to scale to $22 billion by 2027 1. Long-term econometric models utilizing a compound annual growth rate (CAGR) of 15.2% project the broader global affiliate ecosystem to achieve a valuation of $71.74 billion by 2034 234.
This accelerated expansion is fundamentally driven by the capital efficiency of the cost-per-action (CPA) model. Unlike top-of-funnel advertising, affiliate marketing aligns marketing expenditures directly with realized commercial outcomes. As a result, advertisers now categorize affiliate marketing as the third-largest performance channel globally, trailing only paid search and paid social media 1. Current adoption metrics indicate that 81% of global brands actively maintain an affiliate program 567. Furthermore, these programs are highly integrated into modern retail operations, driving an estimated 16% of total global e-commerce revenue 5656. Within the United States specifically, the market is highly mature, with affiliate marketing responsible for $113 billion in e-commerce sales, representing 9.4% of all domestic online retail volume 78.
Regional Market Dynamics and Maturation
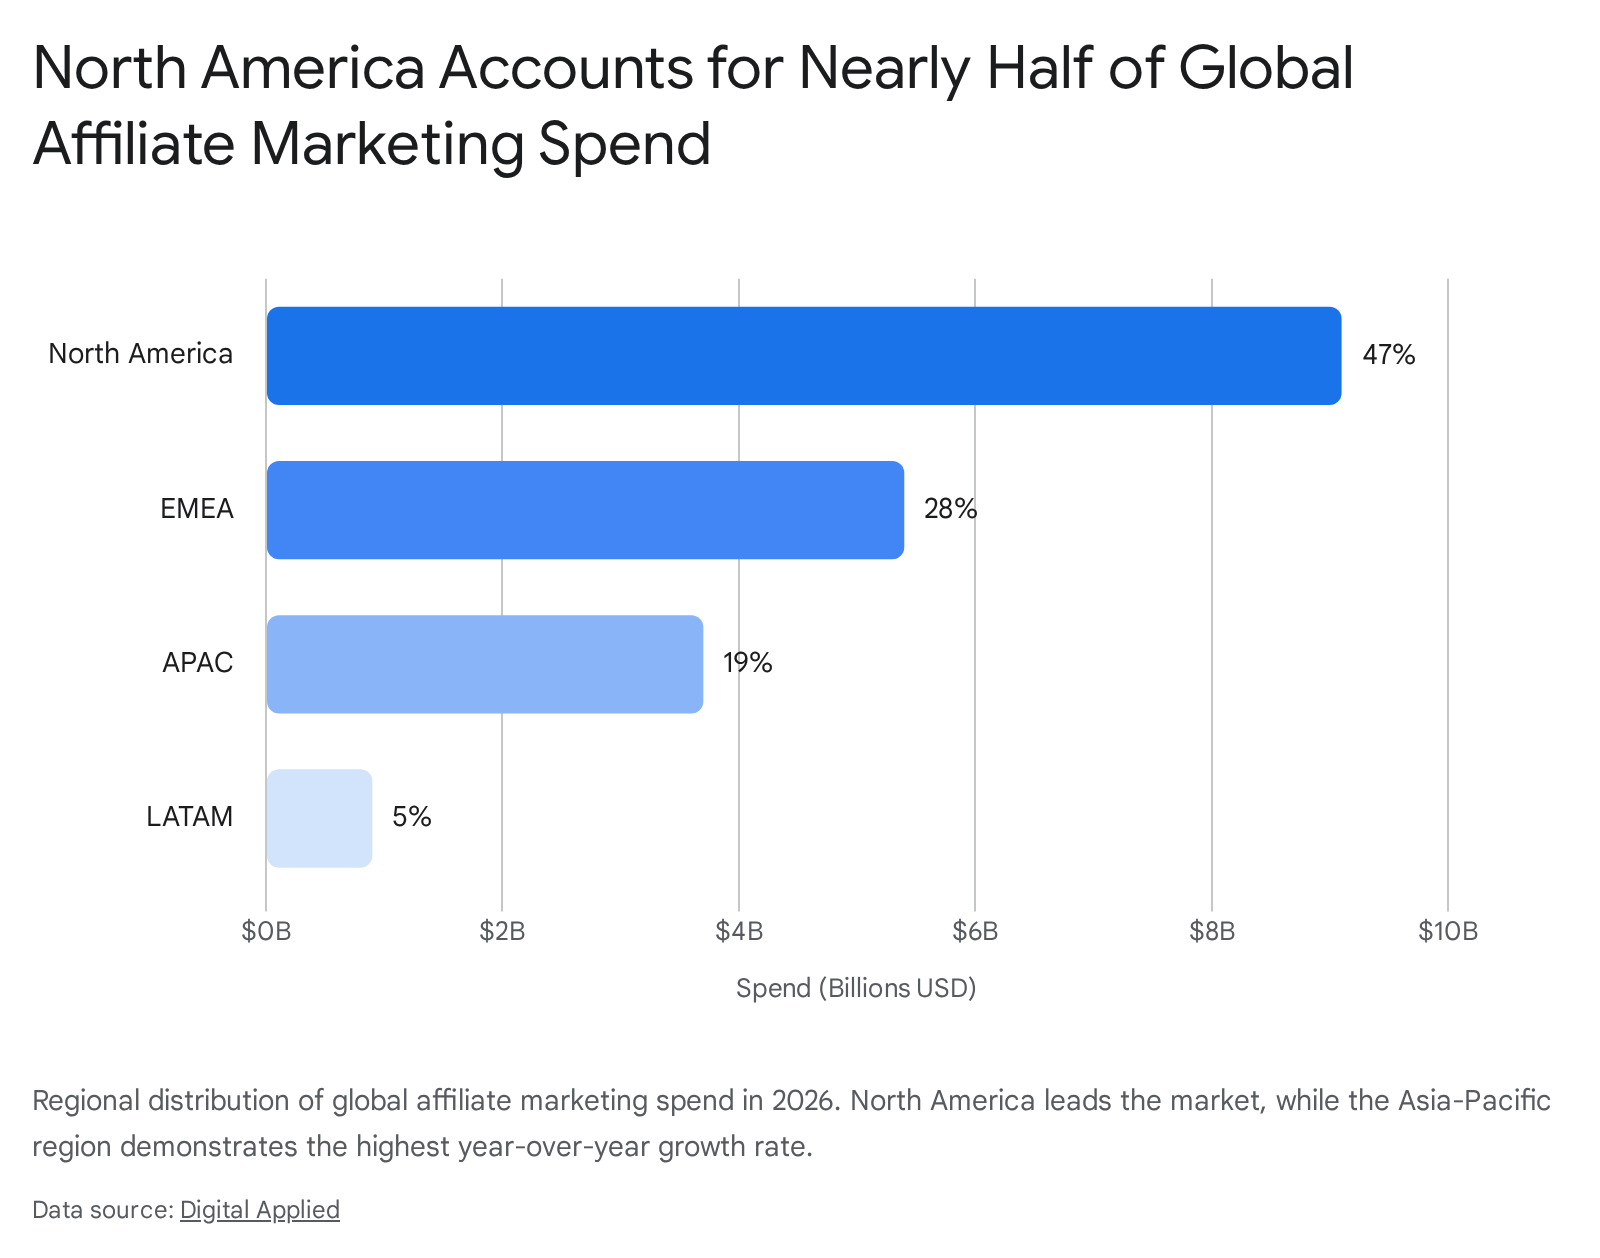
The distribution of affiliate marketing investment highlights varying degrees of e-commerce maturity, regulatory constraints, and mobile technology adoption across different global regions.
North America and European Markets
North America maintains its position as the largest and most mature affiliate market, accounting for 47% of total global affiliate spend in 2026, equating to roughly $9.1 billion 1. The United States operates as the central node of this activity, where annual affiliate ad spending is forecast to exceed $15 billion by 2028 4812. The European, Middle Eastern, and African (EMEA) region collectively accounts for the second-largest share at 28%, or $5.4 billion 1. While Europe benefits from a highly developed e-commerce infrastructure, its regional growth rate is structurally constrained by stringent privacy enforcement. Regulations such as the General Data Protection Regulation (GDPR) and the ePrivacy Directive have tightened consent requirements for browser-based tracking, forcing rapid architectural adaptations among European affiliate networks 1.
Asia-Pacific Market Expansion
The Asia-Pacific (APAC) region currently represents 19% of global spend ($3.7 billion) but functions as the fastest-growing geographical segment, expanding at a regional CAGR of 10% 1910. The expansion in APAC is propelled by high mobile internet penetration - encompassing over 1.4 billion smartphone users - and the widespread integration of social commerce ecosystems 11. Over 60% of affiliate traffic in the APAC region originates from mobile devices, necessitating mobile-first promotional strategies 9.
While China represents the largest sub-market in the region (valued at $1.91 billion), emerging digital economies are driving the accelerated growth rate 10. India's affiliate market is expanding at an 11.8% CAGR, and Southeast Asia is growing at 11.0% 10. In these markets, social commerce formats such as livestream shopping and direct-checkout platform integrations have redefined affiliate marketing 1116. Content creators on platforms like TikTok Shop demonstrate engagement rates on affiliate links that are up to 1,570% higher than comparable influencers on legacy platforms, establishing content-led commerce as the primary driver of regional discovery and conversion 616.
Latin America Market Divergence
Latin America accounts for approximately 5% of global affiliate revenue, generating a market valuation of $925.6 million, with a projected 7.4% CAGR through 2033 91213. While the region is strongly mobile-first - with roughly 84% of e-commerce purchases executed via smartphones - consumer behavior diverges significantly across its two largest markets: Brazil and Mexico 19.
Brazil's digital economy ($396.16 million affiliate market) is characterized by a phenomenon termed "loyalty exuberance." Driven by the rapid adoption of digital wallets and the Pix payment system, Brazilian consumers average 14 different loyalty or reward program memberships, creating a highly competitive environment for visibility among affiliate networks 1314. Conversely, Mexico ($1.67 billion projected loyalty market by 2026) operates with a more selective consumer base in a "value-refinement" phase 14. Mexican consumers average 9.5 memberships but display a high willingness (83%) to engage in "pay-to-play" models, paying upfront fees for guaranteed rewards and bypassing traditional earning phases 14.
Affiliate Economics and Return on Investment
The persistent allocation of enterprise capital toward affiliate marketing is dictated by its robust unit economics. Across diverse consumer and business verticals, affiliate programs consistently deliver an average return on investment (ROI) of $12 to $15 for every $1 spent 4. This translates to an aggregate Return on Ad Spend (ROAS) of 1200% to 1500%, outperforming the baseline averages of programmatic display and paid social media 4. Correspondingly, 65% of participating retailers report that affiliate channels are responsible for generating between 10% and 20% of their total annual revenue 421.
However, revenue generation within the affiliate ecosystem exhibits a steep power-law distribution. Across managed programs, approximately 80% to 90% of total program revenue is generated by the top 5% to 10% of active affiliate partners 122. The median revenue generated per active partner per month sits at $312, whereas top-quartile partners generate upwards of $1,840 1. This mathematical concentration has prompted a shift in program management strategy; rather than pursuing volume-based network expansion, enterprise programs increasingly consolidate resources to support a curated tier of high-performing publishers and creators 815. Furthermore, creator affiliates with 10K - 100K followers generate $0.42 in attributable affiliate revenue per follower per month, significantly outpacing the $0.11 generated by traditional content or display affiliates on an audience-equivalent basis 1.
Vertical Commission Structures and Profitability
Commission rates, conversion metrics, and affiliate profitability vary dramatically depending on the specific industry vertical, typical average order value (AOV), and customer lifetime value (LTV).
| Industry Vertical | Market Share (Revenue) | Average Commission Rate | Economic Model & Affiliate Dynamics |
|---|---|---|---|
| Retail & E-commerce | 44% | 5% - 15% | Relies on high transaction volume to offset lower product margins. Heavily dependent on mass-market creators, coupon sites, and comparison shopping engines 3422. |
| Telecom & Media | 25% | Variable | Characterized by moderate volume and variable payouts. High reliance on specialized review sites and technology publishers 34. |
| Travel & Hospitality | 16% | 4% - 15% | Defined by longer consideration cycles and seasonal fluctuations. Conversions are frequently driven by aggregator platforms and travel content creators 149. |
| Software as a Service (SaaS) | < 10% | 20% - 70% (Recurring) | Low initial transaction volume but high customer LTV. Programs heavily favor recurring monthly commissions, driving strong affiliate retention 122216. |
| E-Learning & Education | < 5% | 20% - 50% | High-ticket digital products. This niche yields the highest average monthly income per affiliate ($15,551) due to zero inventory costs and high margins 34. |
| Finance (Lead Gen) | < 10% | $50 - $200 (Bounty) | Operates on flat-fee bounties for qualified actions (e.g., credit card approvals). Demands high-trust publishers and stringent compliance tracking 13. |
The disparity in commission structures creates significant income inequality among participating affiliate marketers. While the global average affiliate marketer earns approximately $8,038 per month, the median falls well below this figure 359. Approximately 57% of affiliates earn under $10,000 annually, whereas a concentrated tier of highly experienced professionals (15%) earns between $80,000 and $1 million annually 91617. The most lucrative niches - such as SaaS, Finance, and E-learning - are dominated by sophisticated publishers utilizing complex traffic acquisition strategies, programmatic optimization, and high-trust organic content 16.
Consumer Journey Shifts and Conversion Dynamics
In 2026, the quantitative metrics underlying affiliate marketing performance reflect a broader shift in consumer purchasing psychology. The traditional, linear marketing funnel has been largely replaced by a fragmented, comparison-heavy research cycle that alters how conversion rates are evaluated.
Elongated Research and Compressed Execution
Data from the 2025/2026 Impact.com Partnership Benchmark Report highlights a critical evolution in how shoppers interact with affiliate environments. Across the benchmarked retail brands, total clicks on affiliate links increased by 2% year-over-year 18. However, overarching conversion rates declined by 6%, and total transaction volume dropped by 5% over the same period 18.
This statistical divergence demonstrates that consumers are utilizing affiliate environments - such as review sites, influencer content, and comparison engines - primarily for extended research rather than immediate transaction execution. Shoppers engage in prolonged price-monitoring phases, effectively stretching the top and middle of the funnel 18. When consumers eventually finalize their purchasing decisions, they compress their buying activity into highly narrow execution windows, often aligning with major promotional events like Cyber Week 18.
Despite the decline in distinct transaction volume, overall consumer spend fell by only 1% year-over-year. This stability was achieved through strategic bundling; shoppers consolidated multiple items into single, higher-value orders to maximize shipping efficiency or reach threshold discounts. This behavior drove an 8% increase in items per order and a corresponding 4% increase in Average Order Value (AOV), rising from $118 to $123 18. For program managers, this requires a shift in attribution philosophy. Partners producing top-of-funnel content generate 63% of the total clicks but receive credit for only 27% of transactions, as the final click often goes to a loyalty or voucher partner utilized at checkout 18.
Traffic Source and Device Conversion Variations
Conversion rates across the affiliate landscape remain highly sensitive to the user's device and the specific origin of the referral traffic. In 2026, the median e-commerce website conversion rate stands at 2.35%, but this average obscures a stark disparity between mobile and desktop environments 19.
Mobile devices currently account for 62% to 65% of all affiliate-driven traffic 211619. However, mobile conversion rates average a mere 1.82%, trailing desktop conversion rates (3.14%) by 42% 19. This substantial gap persists despite widespread investments in mobile-first design. The discrepancy is driven by checkout friction, form complexity, and the inherent nature of mobile browsing, which frequently involves lower-intent social media engagement and push-notification curiosity 192820. Correspondingly, mobile bounce rates remain structurally higher, sitting at 51.8% compared to 39.7% on desktop 20.
Simultaneously, a new traffic segment has emerged as a high-converting affiliate channel: Artificial Intelligence (AI) search referrals. Traffic originating from conversational AI engines and Large Language Models (LLMs) - including ChatGPT, Perplexity, and Google's AI Overviews - converts at an average of 3.49% 19.
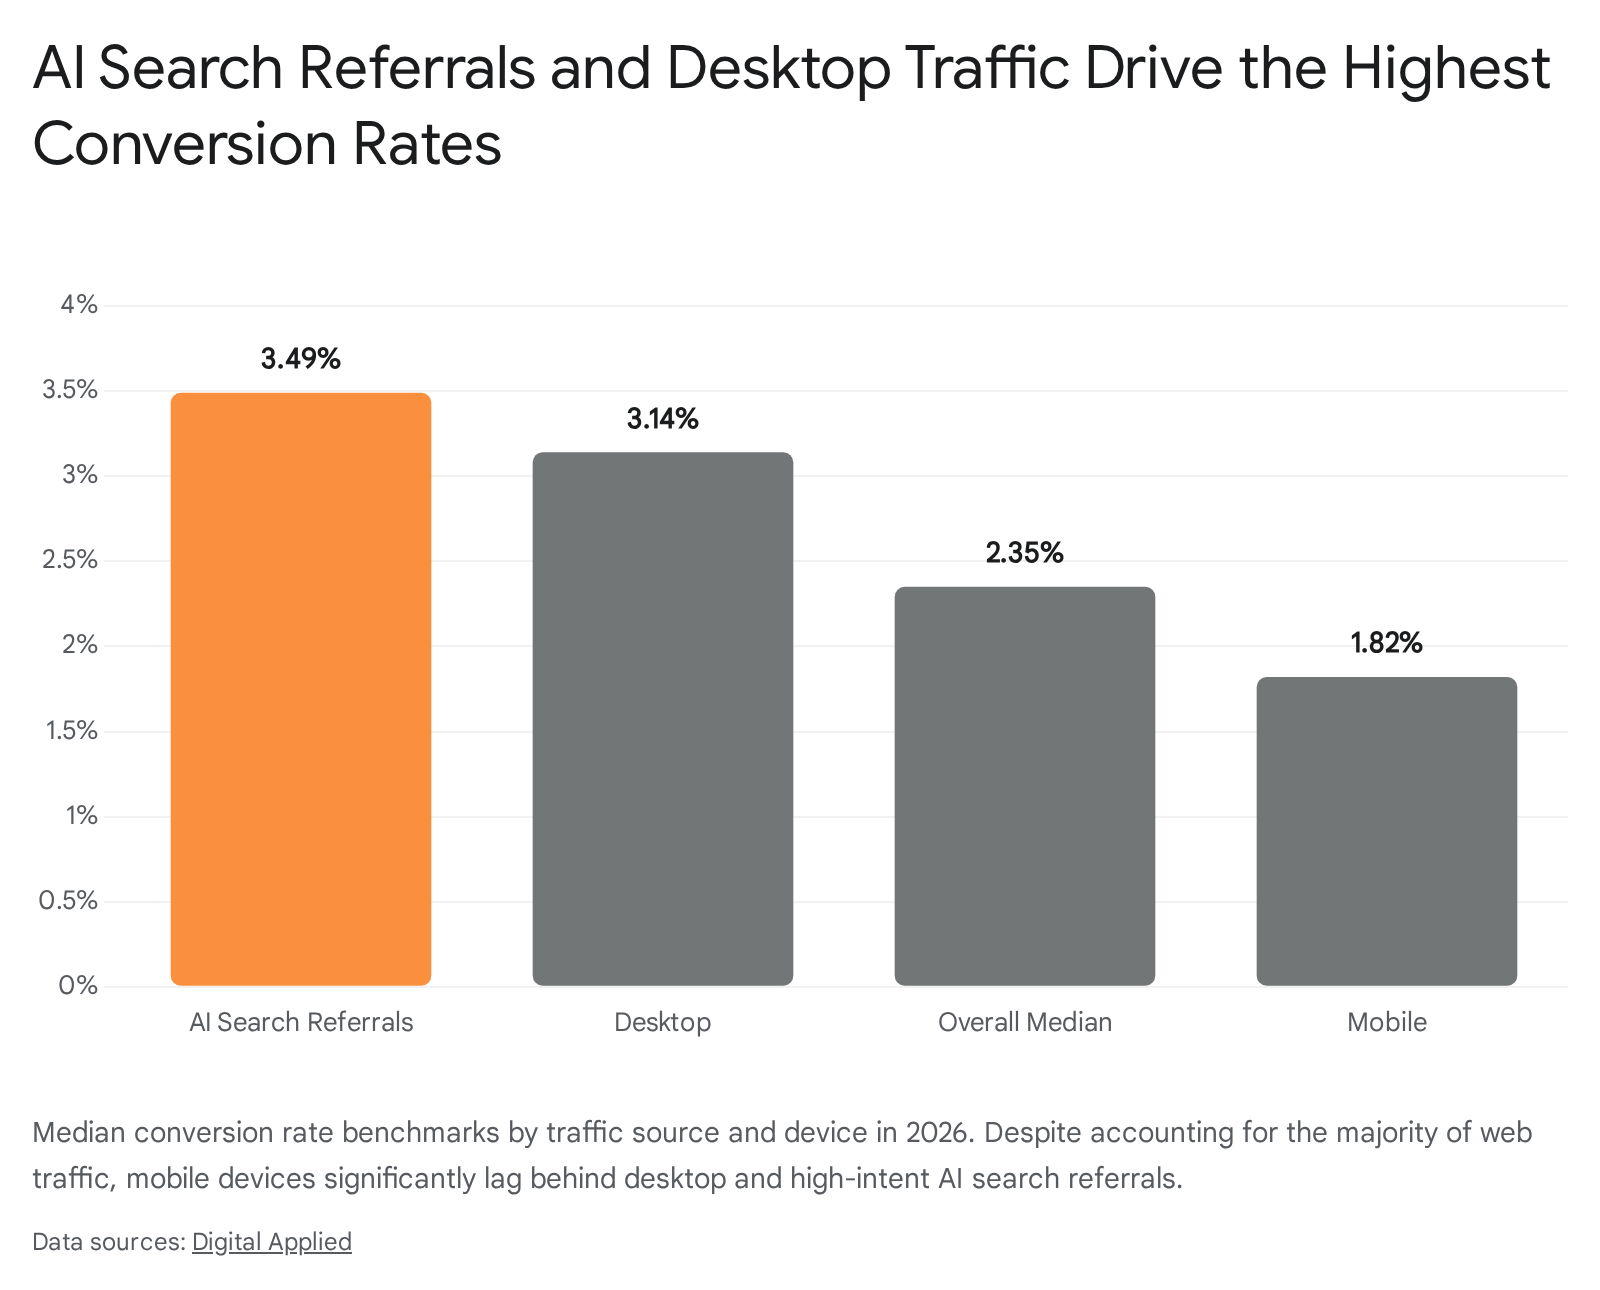
This conversion rate is 22% higher than that of traditional organic search traffic (2.86%) 19. Users leveraging AI search tools arrive at affiliate properties with highly refined intent; the AI interface has already pre-filtered options, effectively moving the user further down the decision funnel before the initial click onto the affiliate property occurs 19.
Website Engagement and Bounce Rate Benchmarks
The quality of affiliate traffic is further evaluated through engagement metrics. In 2026, the cross-industry median bounce rate is 47.4% 20. A major technical limiter for affiliate traffic is page-load speed. Sessions on pages that take longer than 3 seconds to load experience a 38% inflation in bounce rates; below this three-second threshold, content quality dictates engagement, but above it, infrastructure bottlenecks cause immediate user abandonment 20. Furthermore, bounce rates vary drastically by the origin channel. Paid search traffic, possessing explicit query intent, exhibits a 38.6% bounce rate, whereas non-intent channels like display advertising frequently suffer bounce rates exceeding 65% 20.
Business-to-Business and Software-as-a-Service Affiliate Models
While the retail sector continues to dominate the absolute volume of affiliate transactions, the Business-to-Business (B2B) and Software-as-a-Service (SaaS) sectors are experiencing accelerated adoption, growing by 17% year-over-year in the 2025 - 2026 period 45.
The B2B purchasing journey is inherently complex. It involves multiple decision-makers, high price points, and extended evaluation periods that frequently last between 75 and 180 days 2122. Consequently, the traditional B2C affiliate model - which prioritizes rapid volume and immediate coupon conversions - is fundamentally ineffective for B2B applications 1421. In 2026, successful B2B brands are pivoting toward holistic "partner marketing" strategies that reward early and mid-funnel influence rather than relying exclusively on last-click attribution.
To adapt to the protracted sales cycle, SaaS programs increasingly focus on recurring revenue structures and mid-funnel milestones. Currently, 71% of SaaS affiliate programs utilize recurring commission structures, commonly offering 20% to 30% of the subscription revenue for the first 12 months, followed by a declining percentage thereafter 1. The data demonstrates that recurring commission models generate 3.4 times more partner-driven Annual Recurring Revenue (ARR) over 36 months than equivalent flat-bounty programs at the same customer acquisition cost 1.
Furthermore, mature B2B affiliate programs evaluate partner success through rigorous pipeline metrics rather than raw traffic. The cross-industry average for B2B visitor-to-lead conversion is 2.9%, with SaaS platforms specifically converting cold traffic to leads at around 1.1% 22. To maintain partner engagement during long sales cycles, top programs heavily incentivize low-friction, top-of-funnel actions - such as software demo bookings and free-trial signups - allowing the internal sales infrastructure to secure the final transaction 1923.
Tracking Infrastructure and Cookie Deprecation
The technological foundation of digital tracking has undergone a forced architectural rebuild. Historically, the affiliate industry relied almost entirely on third-party cookies injected into a user's browser to track behavior across domains and attribute subsequent purchases back to the originating affiliate 243425. However, strict regulatory frameworks (GDPR, CCPA) and browser-level Intelligent Tracking Prevention (ITP) protocols enacted by Safari and Firefox have systematically degraded this client-side tracking model 3436.
The Migration to Server-Side Tracking
In response to widespread cookie deprecation and the resulting signal loss, the affiliate industry has rapidly transitioned to server-to-server (S2S) tracking infrastructure. Network-level data indicates a profound shift: in 2022, 71% of affiliate programs relied exclusively on third-party cookies; by 2026, that figure has plummeted to 31% 1. Concurrently, 48% of programs now utilize a hybrid tracking approach, and 21% operate entirely on first-party or server-side infrastructure 1.
Server-side tracking fundamentally bypasses the user's browser. When a consumer clicks an affiliate link and subsequently converts, the advertiser's own backend server records the conversion event directly in its database and transmits that postback data securely to the affiliate network's server via an API 3637. This server-to-server method neutralizes the vulnerability of browser-based ad-blockers, iOS privacy restrictions, and cookie-clearing behaviors 3738.
The commercial impact of this infrastructure upgrade is highly measurable. Affiliate programs that migrate to server-side tracking report an 18% to 24% higher volume of attributed conversions compared to programs relying solely on legacy third-party cookies at comparable traffic volumes 1. By sealing the data leaks caused by cookie-blocking browsers, advertisers restore visibility into the true performance of their affiliate partners. Additionally, the viability of long-term attribution windows has collapsed. In 2026, 38% of affiliate programs utilize attribution windows of 7 days or less, effectively shifting the balance of power toward affiliates capable of driving immediate, lower-funnel conversions rather than long-term discovery 1.
Attribution Conflicts and Marketing Measurement
As digital measurement becomes more complex, enterprise marketing departments frequently rely on two distinct mathematical frameworks to allocate multi-million-dollar budgets: Multi-Touch Attribution (MTA) and Marketing Mix Modeling (MMM). A structural conflict between these methodologies heavily impacts the perceived value of affiliate marketing.
Multi-Touch Attribution Versus Marketing Mix Modeling
Multi-Touch Attribution functions at the granular user level. It tracks individual click paths across digital touchpoints to assign fractional credit for a final conversion 3839. Because affiliate marketing fundamentally relies on trackable parameter links, MTA accurately captures and credits affiliate touchpoints. Conversely, Marketing Mix Modeling operates at an aggregate level, utilizing statistical regressions of historical spend data, market seasonality, and total sales volume to determine the overarching causal impact of specific marketing channels 392627. MMM is increasingly favored by executive leadership because it does not require fragile user-level tracking, easily incorporates offline channels like television, and is immune to privacy regulations 392627.
A critical vulnerability in 2026 is that traditional Marketing Mix Models systematically undervalue affiliate marketing performance 28. Because affiliate activity operates predominantly at the very bottom of the funnel (e.g., a cashback portal or a coupon code applied seconds before a checkout is finalized), MMM frameworks frequently interpret affiliate interactions as merely capturing existing demand rather than generating incremental net-new demand 28.
A comprehensive study by Prohaska Consulting revealed that this structural bias leads enterprise brands to heavily underinvest in the affiliate channel 28. The model's inability to accurately isolate sub-channels like influencer content and niche review sites causes businesses to shift budgets away from affiliate marketing toward top-of-funnel brand media. In documented corporate case studies, misinformed budget reallocation driven by flawed MMM outputs resulted in customer volume reductions exceeding 50% 28.
Incrementality Testing and Ecosystem Consolidation
To counteract the structural biases of MMM, sophisticated advertisers are implementing Unified Marketing Measurement (UMM), which uses MMM for high-level quarterly budget strategy, MTA for daily tactical optimization, and rigorous incrementality testing to calibrate the models 383927. Incrementality testing assesses whether a conversion would have occurred without the affiliate's involvement. The data reveals distinct variances by partner type: content and editorial partners demonstrate a 78% incrementality rate, whereas traditional coupon sites show only a 29% incrementality rate, prompting brands to renegotiate commission structures based on true causal value 1.
The urgent necessity for accurate incrementality data has catalyzed unprecedented consolidation within the affiliate technology sector. In April 2026, Rakuten International and impact.com announced a major strategic alliance combining their respective infrastructures 2930313233. Historically, impact.com has provided the underlying SaaS technology for contracting and tracking, while Rakuten Advertising operated as a traditional network providing managed services 303233.
The strategic alliance integrates Rakuten's managed services and impact.com's tracking platform, but its most critical asset is the inclusion of Rakuten Rewards data. Rakuten Rewards provides access to billions of first-party consumer purchase signals derived from a massive cashback user base 293033. By merging deterministic, first-party shopping data with advanced server-side tracking infrastructure, the alliance attempts to mathematically solve the incrementality challenge. Advertisers operating within this unified ecosystem gain visibility into consumer behavior both before and after the affiliate touchpoint, allowing them to definitively prove whether an affiliate partner generated a net-new sale or merely intercepted an inevitable transaction 293133.
Affiliate Fraud and Defensive Artificial Intelligence
As affiliate marketing expands to command nearly $20 billion in global capital, it has inevitably attracted highly sophisticated fraud operations. The financial impact of affiliate fraud is twofold: it directly drains marketing budgets via illegitimate commission payouts, and it corrupts the attribution data that guides future enterprise marketing investments 3748.
Synthetic Traffic and Deepfake Influencers
In 2026, basic fraudulent techniques like cookie stuffing have been largely mitigated by browser restrictions and the shift toward server-side tracking 37. However, malicious actors have escalated their tactics by deploying advanced Artificial Intelligence and Large Language Models (LLMs) to execute fraud at scale.
Fraud rings now deploy AI-powered behavioral emulation bots that generate highly realistic, synthetic user journeys 484934. These bots are trained on actual human browsing datasets to mimic micro-interactions. They issue contextually relevant search queries, replicate human hesitation before clicking ads, scroll at varying speeds, and automatically fill out lead-generation forms using stolen or synthesized identity data 374834.
A specific and severe threat emerging in 2026 is the deployment of "Deepfake Influencers." Fraudsters generate synthetic, AI-generated personas complete with localized images, videos, and distinct personalities. They artificially inflate the social media follower counts of these synthetic profiles and apply to premium affiliate programs 37. Once approved by the network, the operators direct sophisticated botnets to drive fake conversions, masquerading as high-intent social commerce traffic 37.
Machine Learning Defense Mechanisms
To combat the industrialization of fraud, the affiliate industry has widely adopted AI-driven defense mechanisms. Currently, 68% of top affiliate networks deploy machine learning models to screen inbound traffic 51. Single-point, rules-based defense mechanisms are entirely obsolete against adaptive AI; modern defense requires real-time behavioral anomaly detection and cross-channel attribution validation 3749.
These defensive algorithms analyze hundreds of distinct behavioral dimensions per visitor - such as click entropy, engagement depth, and cursor trajectory - comparing them continuously against established baselines of legitimate human interaction 374934. The deployment of network-level AI fraud screening across major platforms has proven highly effective, reducing invalid affiliate traffic (IVT) by 31% year-over-year, dropping from 11.2% of total clicks in 2024 to 7.7% in 2026 1.
Programmatic Search Engine Optimization in Affiliate Content
On the publisher side of the ecosystem, Artificial Intelligence has fundamentally altered how affiliate marketers generate organic traffic. Organic search (SEO) remains the dominant acquisition channel, accounting for over 50% of all affiliate traffic globally 517. To maximize search visibility across diverse niches, sophisticated affiliates rely heavily on Programmatic SEO (pSEO).
Programmatic SEO is the automated creation of hundreds or thousands of landing pages utilizing structured data, customized templates, and code. It is designed to capture highly specific, long-tail search queries at scale (e.g., "[Software A] vs. [Software B] for [Specific Industry in Specific City]") 3536. Historically, pSEO relied on basic "template swaps" - changing a single keyword variable across functionally identical pages. However, in 2024, search engine algorithm updates began heavily penalizing this practice, classifying it as "scaled content abuse" or thin doorway pages designed solely to manipulate rankings 37.
In 2026, successful programmatic SEO in affiliate marketing requires utilizing AI strategically for deep content enrichment rather than mere variable generation. Instead of basic template swaps, modern pSEO systems leverage AI to synthesize distinct insights, summarize user-generated reviews, and generate highly specific data comparisons for every single page 353755. To maintain search engine rankings and avoid algorithmic penalties, contemporary standards dictate that each programmatically generated page must feature at least 60% unique content, aggregate data from a minimum of three disparate sources, and provide genuine informational value beyond what is already visible on the search engine results page 3755.
When executed according to these quality thresholds, pSEO allows resource-constrained affiliate publishers and B2B SaaS startups to build massive organic "content moats." This methodology systematically addresses specific user intent across millions of query permutations at a scale that manual human copywriting simply cannot match 3536.