2026 Paid Social Advertising Performance Benchmarks by Platform
Executive Summary
As the global digital advertising ecosystem transitions through the first quarter of 2026, the industry is undergoing a profound structural and operational realignment. The theoretical marketing trends projected in the early 2020s - agentic artificial intelligence, the fragmentation of traditional addressability, and the convergence of content with commerce - have matured into definitive operational realities 12. Based on a comprehensive synthesis of late 2025 actuals, verified Q1 2026 performance data from leading ad-tech auditors (such as Tinuiti, Merkle, and Skai), and recognized industry projections from marketing science journals, this report provides an exhaustive analysis of the global ad-tech landscape. It is imperative to note that while Q1 2026 figures represent deterministic historical data, full-year 2026 projections remain inherently subject to macroeconomic volatility, ongoing regulatory interventions, and unannounced algorithmic updates; consequently, uncertainty is explicitly acknowledged where forward-looking models are utilized 123.
The findings indicate that while digital ad spend remains highly robust - with global advertising spend projected to surpass the $1 trillion threshold for the first time in 2026 - the fundamental mechanics of how value is generated and measured have shifted entirely 23. The proliferation of AI-driven campaign automation tools, such as Meta's Advantage+, Google's Demand Gen, and TikTok's Smart Performance Campaigns, has effectively commoditized media buying execution, moving the competitive advantage away from manual targeting toward creative strategy and first-party data infrastructure 456. Furthermore, the protracted and complex deprecation of third-party cookies, combined with the stringent enforcement of the Digital Markets Act (DMA) in Europe, has precipitated a measurement crisis, fundamentally altering the accuracy of reported Return on Ad Spend (ROAS) and Cost Per Acquisition (CPA) metrics across all platforms 78. To successfully navigate this convoluted landscape, modern marketers require highly calibrated benchmarks that explicitly differentiate between Business-to-Business (B2B) and Business-to-Consumer (B2C) operational realities across diverse geographic tiers.
The Macroeconomic and Digital Advertising Landscape: Q1 2026 Validation
The first quarter of 2026 delivered a clear verdict on the resilience and trajectory of digital advertising: institutional spend is accelerating despite rising absolute costs and heightened regulatory scrutiny 911. According to verified Q1 2026 audit data from leading performance marketing firms managing billions in global ad spend, four of the five largest digital ad segments in the United States experienced accelerated spending growth year-over-year 2. The global market is expanding at a projected rate of 5.1%, easily outpacing the broader global economic expansion estimate of 3.1%, cementing media investment as a direct, non-negotiable driver of business growth for enterprise organizations 3.
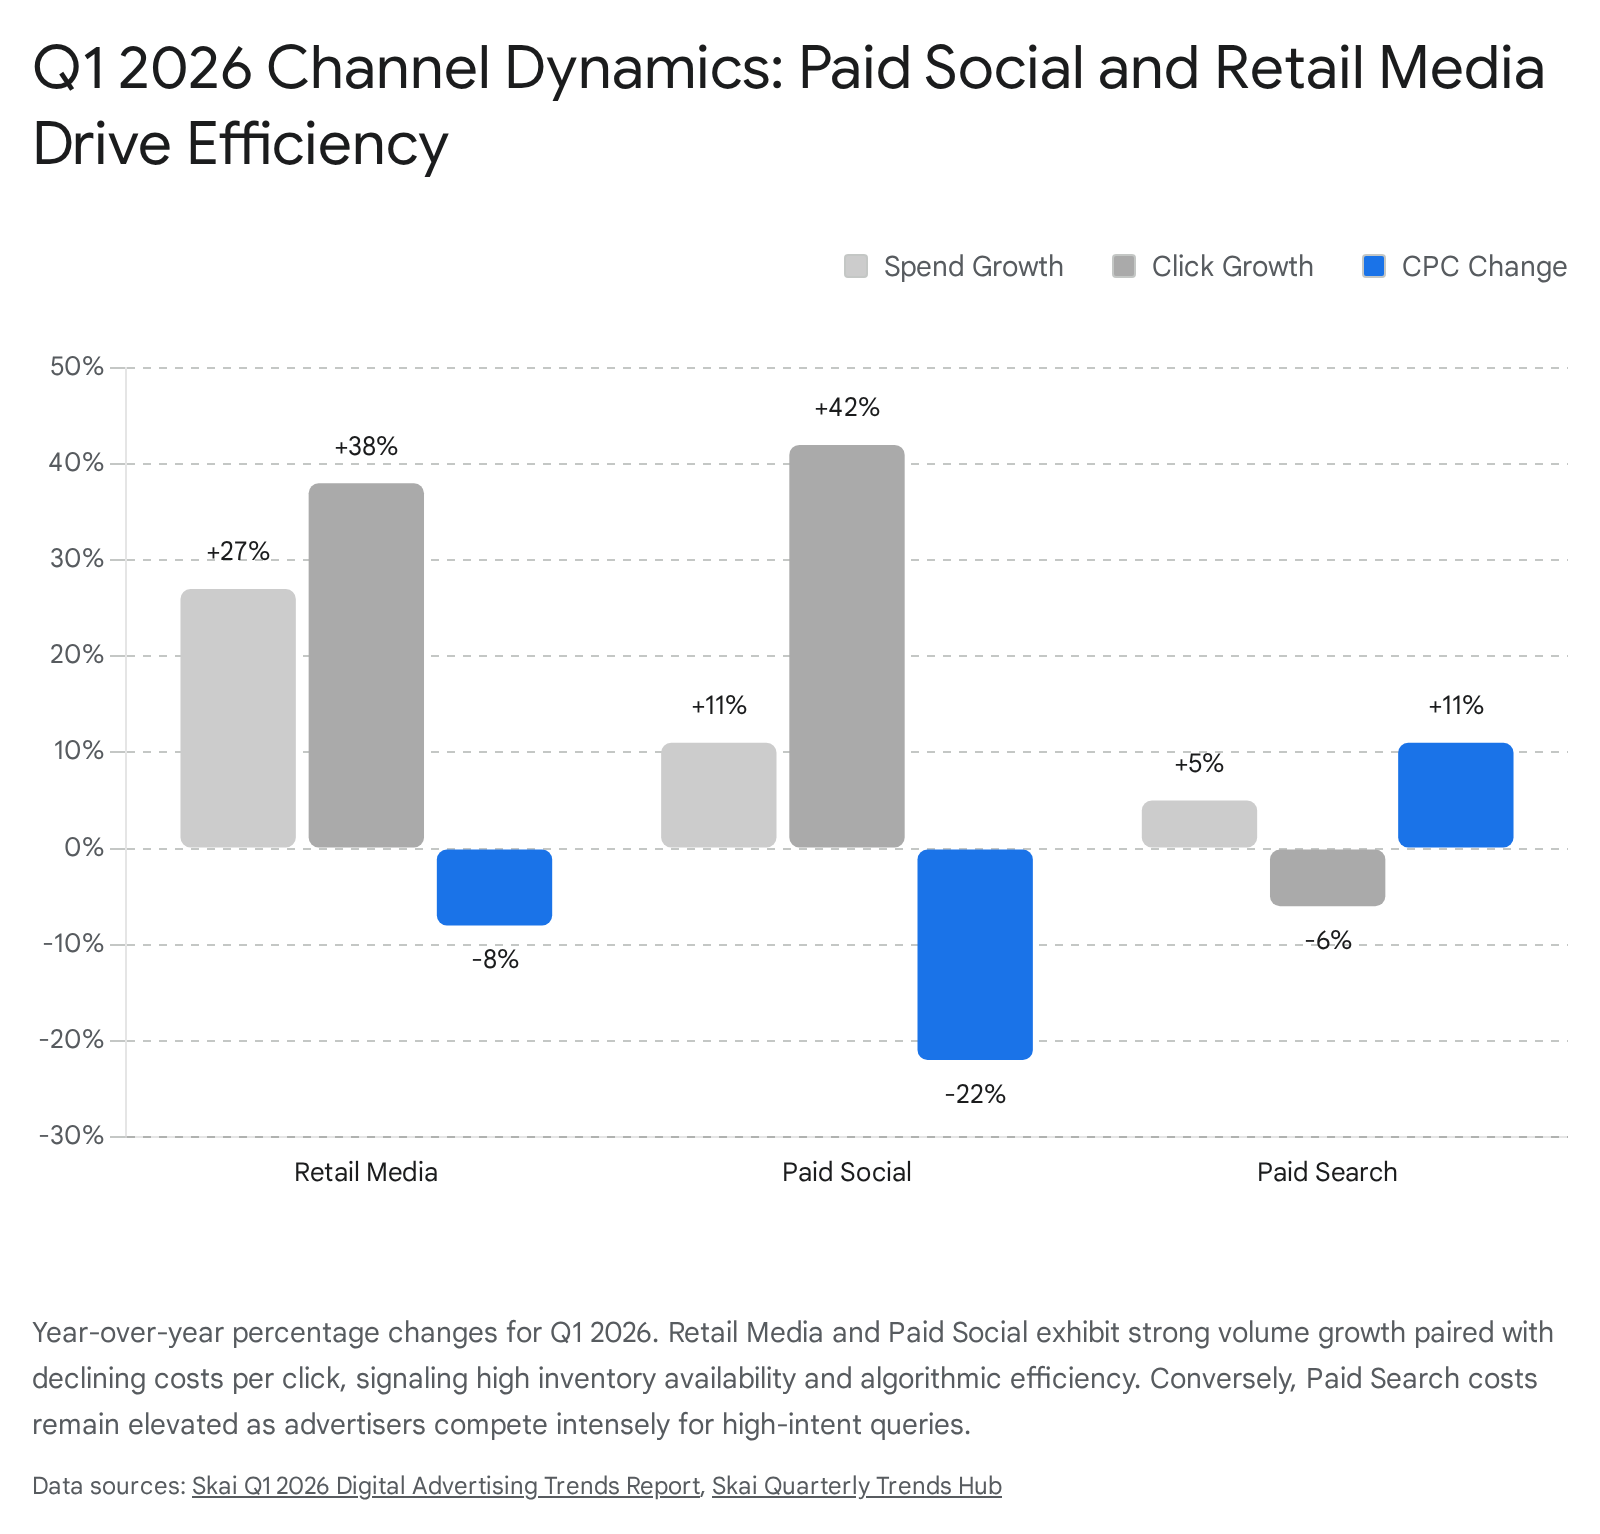
A detailed sector analysis reveals that Retail Media emerged as the primary growth vector, opening 2026 with an unprecedented 27% year-over-year increase in overall spend 910. This spending surge was accompanied by a 38% surge in click volume and, uniquely, an 8% decline in Cost Per Click (CPC) across all retail categories 910. This dynamic signals a structural shift in how the lower funnel is funded, with platform-native retail environments capturing dollars that historically belonged to open-web display networks.
Conversely, the paid search environment has grown increasingly selective and expensive. While Google Search ad spend grew by 14% year-over-year in Q1 2026 - marking the highest growth rate observed in nearly two years - this expansion was driven primarily by an 11% increase in search ad clicks alongside sustained, record-high CPCs 1110. For highly competitive generic queries, the average search CPC climbed 11% year-over-year to reach $1.10, matching previous all-time highs 10. Meanwhile, brand keyword CPCs experienced intense volatility, with some advertisers seeing brand click costs jump by 19% year-over-year 11. In response, advertisers are actively pruning low-value search queries, redirecting budgets strictly toward long-tail, high-intent terms that reliably convert, demonstrating a disciplined retreat from volume-chasing in favor of margin protection 10.
Simultaneously, paid social channels demonstrated exceptional efficiency gains throughout late 2025 and early 2026. Overall paid social spend rose 11% year-over-year, while total clicks surged by an impressive 42% 10. This dynamic was driven by the massive expansion of short-form video inventory, particularly Instagram Reels and TikTok, which expanded supply faster than advertiser demand could fill it, ultimately causing paid social CPCs to fall by 22% in the aggregate 10.
Underpinning these macro shifts is a critical transition in the role of artificial intelligence. As noted by marketing science analysts, AI has moved from a supportive execution layer to the primary decision layer 1. Agentic systems are no longer merely assisting in bid adjustments; by late 2026, agentic AI is expected to move from pilot projects into core production infrastructure, autonomously reallocating budgets, managing cross-platform bids, and optimizing creative delivery in real-time 112. This shift mandates a severe reevaluation of standard performance benchmarks, as algorithms now prioritize blended audience signals and predictive modeling over discrete, human-defined targeting parameters.
The Measurement Crisis: Third-Party Cookie Deprecation and Privacy Regulations
The foundational infrastructure of digital marketing measurement - specifically the third-party cookie and cross-site behavioral tracking - is in a state of terminal decay. Understanding campaign benchmarks in 2026 is impossible without contextualizing the massive attrition of signal fidelity.
The Trajectory of Signal Loss
The deprecation of third-party tracking is not a sudden event but a prolonged historical process. Safari introduced Intelligent Tracking Prevention (ITP) in 2017, followed by Mozilla Firefox's Enhanced Tracking Protection in 2019, which effectively removed third-party cookies for roughly 30% to 40% of all internet traffic 71513. In 2021, Apple's App Tracking Transparency (ATT) framework in iOS 14.5 mandated explicit user opt-ins, severely limiting deterministic tracking on mobile devices and devastating the initial ROAS reporting capabilities of platforms like Meta and TikTok 1314. Apple's Privacy Report for 2026 indicates that up to 78% of iPhone users continue to actively reject app tracking 14.
The ultimate catalyst, however, was the fate of Google Chrome. After years of delays due to regulatory pushback from the Competition and Markets Authority (CMA), Google initiated the deprecation of third-party cookies for 1% of Chrome users (approximately 30 million people) in January 2024 to facilitate testing of its Privacy Sandbox 1518. However, in July 2024, Google pivoted dramatically, announcing it would abandon total deprecation in favor of a user-level "informed choice" opt-in model that applies across the entire web browsing experience 151815. Despite this pivot, the reality for advertisers remains dire: user opt-in rates for tracking are persistently low, meaning that the practical impact is identical to outright deprecation. By 2026, the cookieless future is not merely an impending threat; it is the operational reality for millions of digital consumer touchpoints 7.
The Attrition of ROAS Accuracy and Funnel Visibility
The loss of third-party cookies and cross-site identifiers directly fractures the accuracy of reported ROAS, Cost Per Acquisition (CPA), and overall funnel visibility. In 2026, relying primarily on client-side browser pixels for attribution guarantees catastrophic data loss. Privacy regulations and cookie rejections are causing an average of 25% to 40% deterministic data loss in environments like Google Ads 14.
When an advertising platform's pixel cannot connect a top-of-funnel click on a publisher's site to a bottom-of-funnel purchase on a merchant's domain due to a blocked cookie, the platform loses the attribution signal. Consequently, an ad platform might report 100 conversions, while the merchant's actual internal sales data registers 150 7. This discrepancy renders traditional ROAS calculations highly inaccurate, blinding media buyers to the true efficacy of their campaigns.
Without accurate conversion feedback loops, algorithmic optimization models fail. Frequency capping mechanisms degrade, resulting in users being bombarded with repetitive ads, which harms brand equity 1815. Furthermore, lookalike audience modeling suffers severely; algorithms possess fewer behavioral signals regarding converters, forcing prospecting campaigns to rely on broader, less efficient contextual parameters 715. As a direct result, Google Marketing Platform Insights reveals that average CPA increases by 21% when third-party cookies are unavailable to guide algorithmic targeting 14.
The European Regulatory Escalation: GDPR and the DMA
The measurement crisis is exacerbated exponentially in European markets, where regulatory bodies have aggressively dismantled the ad-tech industry's core behavioral business model. The General Data Protection Regulation (GDPR) has been enforced with increasing severity. Notable enforcement actions include the Irish Data Protection Commission (DPC) levying a record 1.2 billion euro fine against Meta in 2023 for unlawful international data transfers, and a 310 million euro fine against LinkedIn in 2024 challenging the platform's claim that targeted advertising was a necessary contractual requirement 20. Furthermore, the French regulatory authority (CNIL) fined Optimove 1 million euros in late 2025, establishing that data processors share equal liability with publishers for data retention and tracking violations 20.
The most transformative regulatory shift, however, stems from the European Union's Digital Markets Act (DMA). The DMA effectively outlawed the coercive "consent or pay" models previously utilized by major publishers. By 2026, platforms like Meta are legally compelled to offer EU users a "reduced data sharing" option for free 8. This option relies solely on broad contextual targeting rather than highly personalized behavioral tracking 8. For advertisers operating in Europe, this means a significant portion of the audience is now untargetable through legacy metrics, leading to weaker returns, higher CPAs, and a mandatory reliance on less efficient macro-level marketing strategies.
The Strategic Imperative: AI-Ready Data Foundations and Server-Side APIs
The massive divergence in 2026 media performance is no longer dictated by which agency has access to the best AI. Automation tools like Performance Max, Smart Bidding, and Advantage+ are democratized across all advertiser accounts 6. Instead, as noted by digital analytics experts at Merkle, the competitive advantage relies entirely on data maturity; AI models only perform as well as the proprietary data they are trained upon 6.
To bridge the widening attribution gap, enterprise advertisers are systematically abandoning vulnerable client-side browser pixels in favor of robust server-side tracking architecture 714. Technologies such as Meta's Conversions API (CAPI), Google's Enhanced Conversions, and TikTok's Events API establish a direct, secure data stream from the merchant's backend server to the advertising platform's server 7.
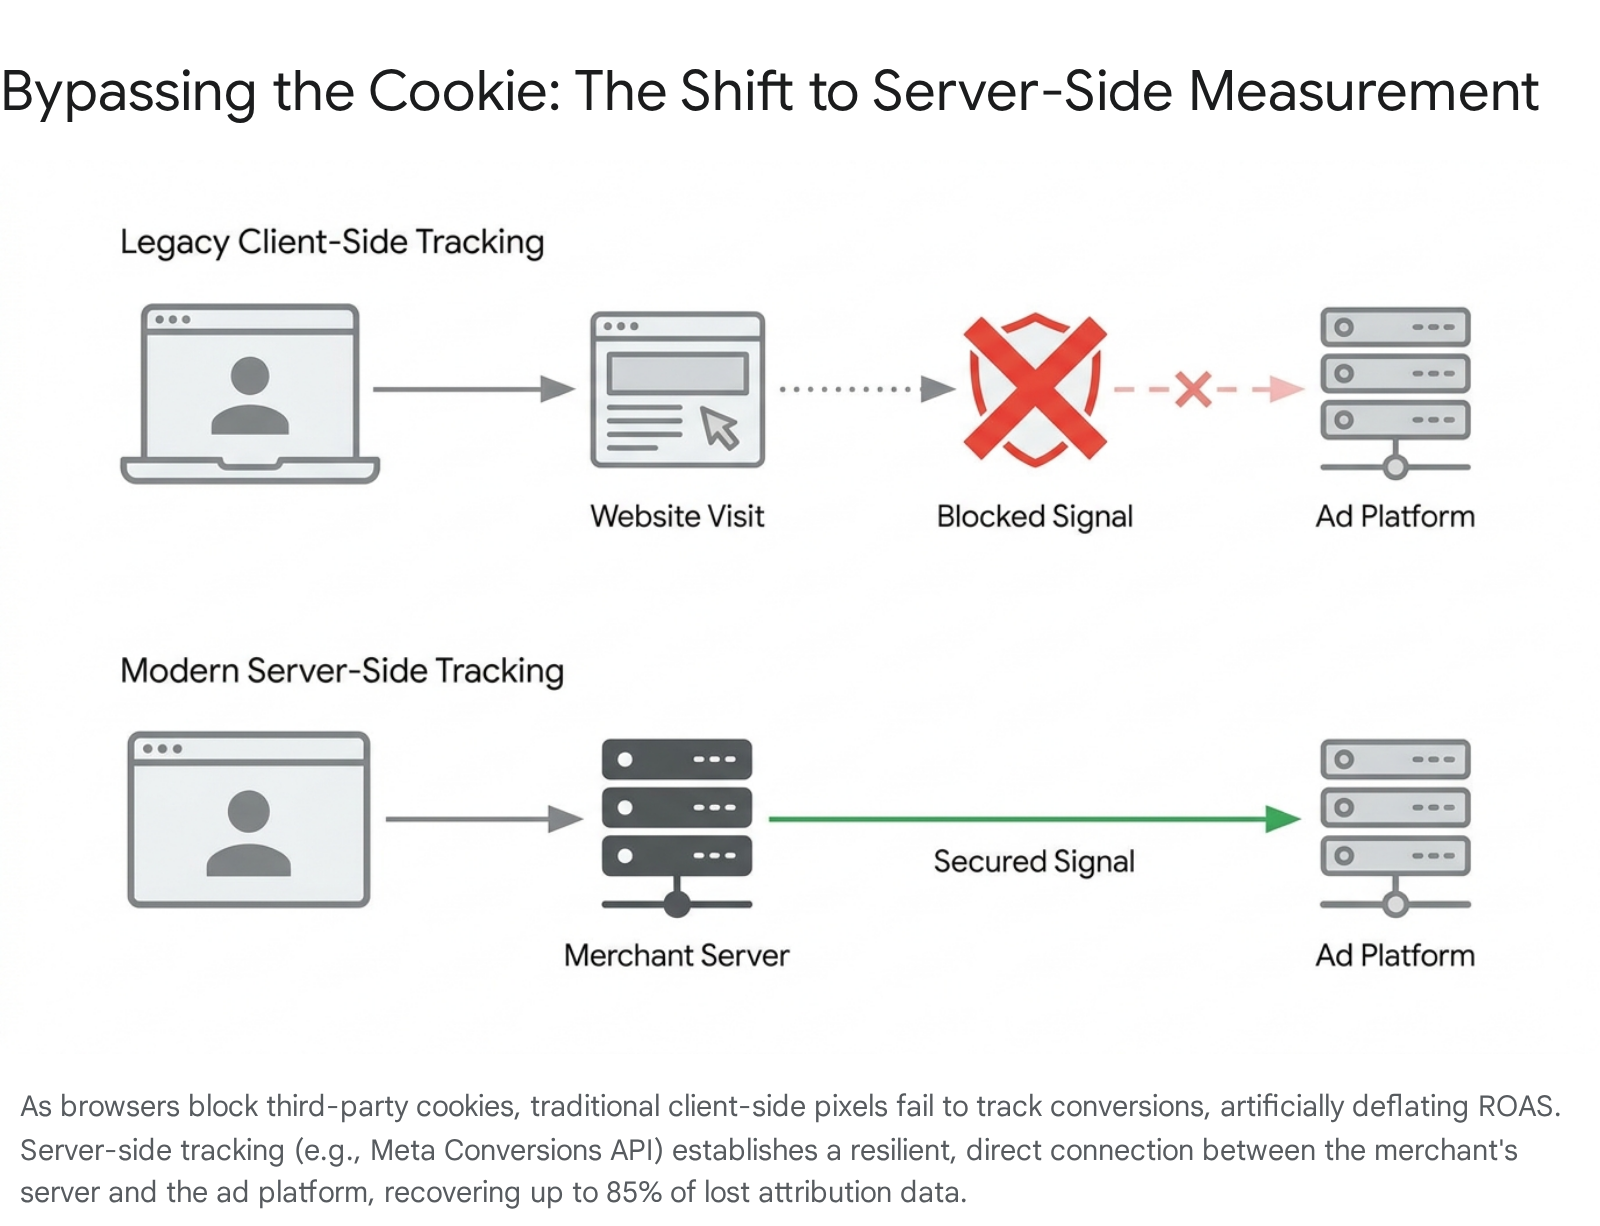
By passing first-party conversion data directly, marketers completely bypass browser-level cookie blocking and ad-blocker extensions 7. Agencies deploying server-side tracking combined with consent-mode analytics report recovering an average of 85% of their lost measurement data, driving a 23% overall improvement in campaign performance outcomes compared to legacy pixel setups 14.
The AI Automation Paradigm: Execution vs. Generation
The defining paradigm shift in 2026 media buying is the total transition from manual, human-directed interest targeting to fully automated, AI-driven campaign architectures. Digital platforms have recognized that human media buyers simply cannot calculate bidding probabilities across billions of real-time, cross-surface auction variables. Consequently, systems relying on predictive machine learning have become the standard methodology for achieving scale.
Algorithmic Campaign Management: The End of Manual Control
In traditional, manually managed campaigns, advertisers execute granular control, selecting explicit demographics, behaviors, interests, and bid caps across dozens of isolated ad sets. This legacy approach assumes that the advertiser possesses superior strategic context regarding their buyer persona. In stark contrast, AI-automated campaigns consolidate budget into a single, unified environment, leveraging predictive modeling to identify high-value users based on immense volumes of historical conversion data, device signals, and real-time behavioral velocity across the entire internet 41622.
The performance delta between manual and automated systems is mathematically undeniable. In 2026, Meta's Advantage+ Shopping Campaigns (ASC) consistently deliver an average 32% lower Cost Per Acquisition (CPA) compared to manually configured campaigns across e-commerce verticals 2317. This extreme efficiency is driven by the AI's ability to bid fluidly across all Meta placements - Reels, Stories, and the standard Feed - simultaneously, securing the cheapest available conversion at any given microsecond rather than being constrained by human-imposed placement limitations 4. Furthermore, ASC algorithms exit the volatile "learning phase" roughly 30% faster than manual setups, allowing advertising budgets to scale rapidly to peak performance in days rather than weeks 4. Furthermore, Meta removed dozens of specific detailed targeting interest categories in early 2026, actively deprecating manual controls to force algorithmic adoption 23. For brands embracing ASC, return on ad spend (ROAS) often increases by 15% to 22% 422.
A similar evolution has redefined TikTok advertising. TikTok's Smart Performance Campaigns (Smart+) automate nearly all targeting, bidding, and creative optimization decisions. Internal testing and agency data reveal that Smart+ campaigns outperform manual setups in over 80% of test cases, yielding an average 10% to 15% reduction in CPA and an 8% to 20% lift in ROAS 1618. However, algorithmic success requires sufficient data density; Smart+ requires a minimum of 50 conversions per week and a daily budget equating to 20 times the target CPA to maintain stable optimization 1618. By automatically identifying top-performing assets and reallocating budget in real time, Smart+ extends the lifespan of winning creative, mitigating the rapid creative fatigue that historically plagued the TikTok ecosystem 1826.
Within the Google ecosystem, "Demand Gen" has become the central campaign type for all visual, engagement-driven advertising, having absorbed both Discovery Ads and Video Action Campaigns by late 2025 527. Demand Gen distributes ad delivery across YouTube, Discover, Gmail, and the Google Display Network. Google's internal algorithmic benchmarks reveal a critical insight for 2026: advertisers who provide the AI with a diverse asset mix - specifically running both video and high-quality static images within the same Demand Gen campaign - generate 20% more conversions at an equivalent CPA compared to campaigns running video alone 5. A video-only campaign is effectively absent from Google Discover and Gmail inventory, severely capping the AI's ability to find cost-effective conversions 5.
The Generative AI Creative Paradox: High Clicks, Lower Trust
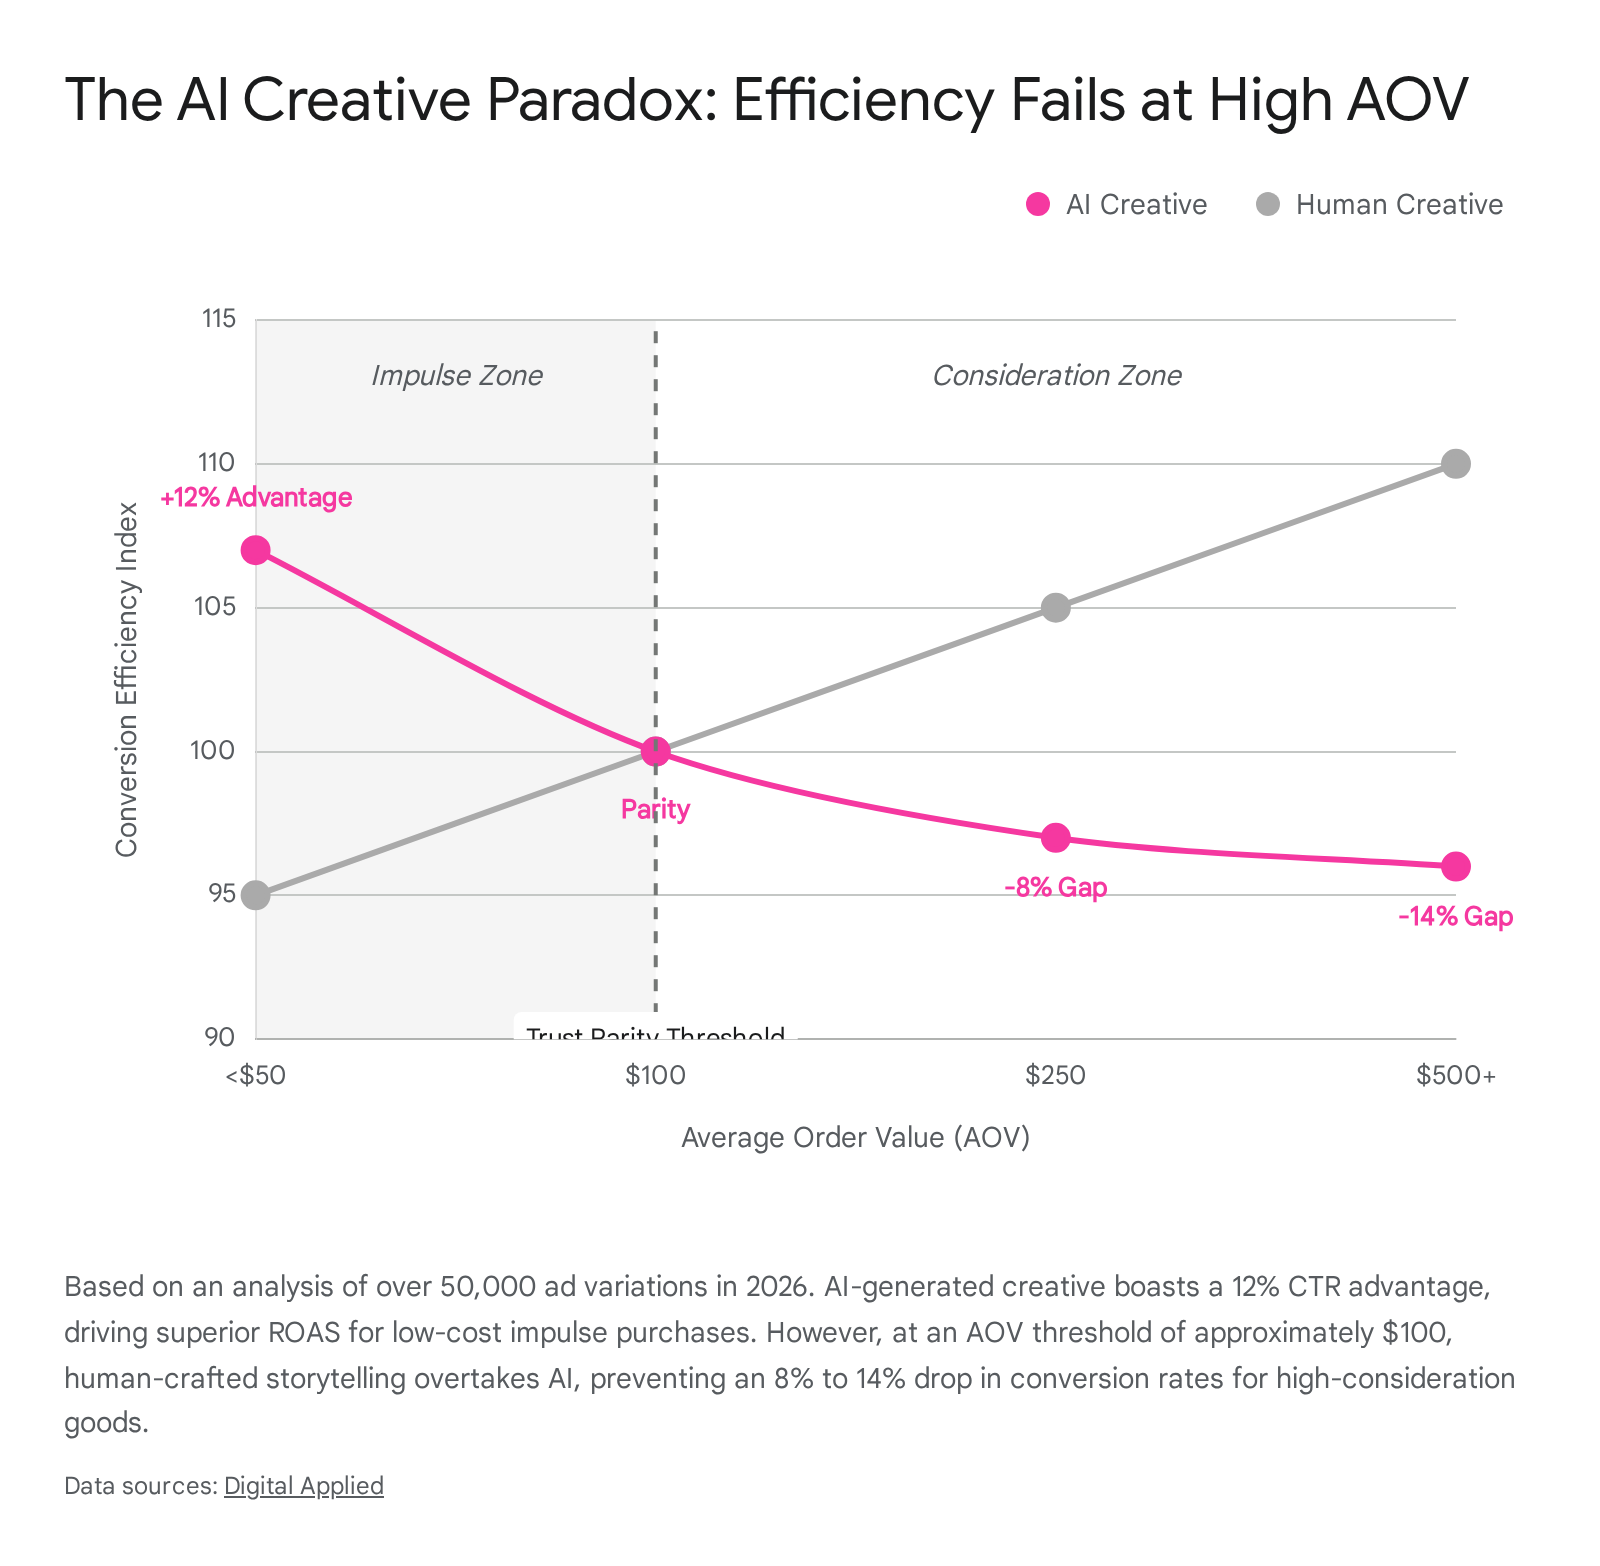
While AI excels at predictive media distribution, the application of Generative AI in the actual production of creative assets presents a complex, nuanced reality. According to comprehensive 2026 benchmark analyses evaluating over 50,000 ad variations across Meta, Google, and TikTok, AI-generated ad creative consistently outperforms human-produced ads on top-of-funnel engagement metrics 19. Specifically, AI-generated assets boast an average 12% higher Click-Through Rate (CTR) on Meta platforms and an 18% higher CTR overall 1719. This advantage is rooted in the AI's capacity for rapid iteration - generating, testing, and optimizing hundreds of visual hooks, text overlays, and copy permutations to find the exact combinations that halt user scrolling behavior 171920.
However, this top-of-funnel efficiency often masks a critical bottom-funnel failure. For high-consideration purchases - defined as products with an Average Order Value (AOV) exceeding $100 - AI-generated creative converts 8% worse than human-crafted assets 19. For premium products exceeding $500, this conversion gap widens drastically to 14% 19. The data indicates the existence of an "uncanny valley" in consumer trust. Consumers clicking on AI-optimized ads browse heavily but abandon carts frequently when faced with complex, high-stakes purchasing decisions 19. AI excels at capturing immediate attention for low-AOV impulse buys - where AI ROAS reaches full parity with human creative - but it currently lacks the emotional resonance, authentic storytelling depth, and nuanced brand credibility required to close high-trust, relationship-based sales 1930.
Consequently, the strategic imperative for leading brands in 2026 is the deployment of a hybrid framework. Marketers are utilizing Generative AI tools to scale the 60% to 70% of creative volume that drives immediate direct-response conversions at low price points, saving an estimated 20 hours per week in production time 19. Concurrently, they are reserving premium human creative talent for foundational brand storytelling, emotional alignment, and the positioning of high-value goods 1930.
Table 1: AI-Automated vs. Traditional Campaign Metrics (2026 Benchmarks)
The following table synthesizes the performance differentials between traditional human-managed media buying and the current state of predictive AI automation frameworks across major ad networks.
| Metric / Dimension | Traditional / Manual Campaigns | AI-Automated Campaigns (Advantage+, Smart+, PMax) | Performance Delta |
|---|---|---|---|
| Setup & Creation Time | High (Extensive ad-set testing and demographic research) | Low (Consolidated structures; minimal inputs) | -26% to -70% time reduction 418 |
| Learning Phase Duration | 1 to 3 weeks (High budget decay during testing) | 3 to 7 days (Rapid signal processing across network) | 30% faster stabilization 416 |
| Cost Per Acquisition (CPA) | Acts as the baseline performance metric | Highly efficient due to real-time micro-bidding | -12% to -32% reduction 41623 |
| Return on Ad Spend (ROAS) | Stagnating or flattening growth curve | Superior predictive Lifetime Value (LTV) modeling | +8% to +22% improvement 1622 |
| Generative Creative CTR | Human baseline benchmark | Gen-AI enables massive permutation testing | +12% to +18% higher CTR 1719 |
| High-AOV Conversion (>$100) | Drives trust and emotional brand narrative | Suffers from credibility gaps and perceived inauthenticity | -8% to -14% worse CVR 19 |
Analysis synthesized from Meta, TikTok, and independent marketing science performance data covering late 2025 through Q1 2026 cohorts.
Master Cross-Platform Performance Benchmarks (2026)
To accurately evaluate campaign health, performance benchmarks must be deeply contextualized by both the advertising platform's intrinsic architecture and the user's intent state. A blended average spanning all platforms or combining B2B with B2C campaigns is statistically flawed and practically dangerous. The following analysis dissects Q1 2026 benchmarks, explicitly differentiating operational realities across sectors.
Meta (Facebook and Instagram): The B2C Conversion Engine
Meta remains the apex environment for direct-response consumer advertising, driven by the sheer scale of its 3.07 billion monthly active users and the maturity of its Advantage+ predictive modeling 1731. In early 2026, the average CPC across all industries on Facebook reached $1.72, representing an 11% year-over-year increase 17.
However, top-line CPCs obscure massive variations by sector. B2C sectors benefit from broad appeal and visually engaging formats. Apparel & Fashion and Food & Beverage enjoy highly efficient CPCs of $0.89 and $0.78, respectively, yielding exceptional ROAS profiles of 4.12x and 3.28x 32. Conversely, B2B and high-consideration sectors pay a severe premium on Meta due to the lack of deterministic professional targeting. Legal Services command a massive $4.45 CPC, and B2B SaaS averages $2.94, resulting in a much lower B2B ROAS average of 1.62x 32.
From a reach perspective, the global median Cost Per Mille (CPM) sits between $11.54 and $14.19 across the Meta ecosystem 1733. However, placement selection drastically alters efficiency. Instagram Stories currently average a highly efficient $6.25 CPM and a low $1.83 CPC, offering excellent direct-response inventory, whereas standard Instagram Feed placements demand a premium $7.68 CPM and a staggering $3.35 CPC due to their higher perceived purchase intent 3435. The critical metric for B2C advertisers on Meta is CPA; in 2026, the cross-industry average CPA ranges from $23.10 to $30.00, rendering Meta highly profitable for consumer goods with sufficient margins 34.
TikTok: The Short-Form Visual Discovery Platform
TikTok's platform architecture fundamentally alters standard ad metric evaluation. A Click-Through Rate (CTR) of 0.84% that might appear mediocre on Meta actually represents excellent, conversion-optimized performance on TikTok 3637. In 2026, TikTok remains highly cost-efficient for top-of-funnel reach, with CPMs averaging between $6.20 and $9.16 depending on the industry vertical 3638. CPCs are exceptionally low, hovering tightly between $0.44 and $1.00 3638.
The divergence between B2B and B2C performance is more pronounced on TikTok than any other network. B2C e-commerce and Beauty brands achieve impressive Conversion Rates (CVR) ranging from 2.10% to 4.00%, supported by the platform's seamless social commerce integrations and rapid visual product demonstrations 3738. High-ticket consumer goods, however, struggle; the Sports & Outdoors category sank to a 1.49% CVR, indicating that the fast-scrolling environment limits the ability to convert research-heavy purchases 21.
For B2B advertising, TikTok is structurally hostile to direct-response goals. B2B SaaS and Financial campaigns yield an abysmal CVR of just 0.3% to 1.0% 37. The entertainment-first interface is fundamentally at odds with the multi-stakeholder purchasing behavior inherent to enterprise technology 21. Consequently, B2B advertisers utilizing TikTok in 2026 must optimize for "Engaged Views" (a 6-second focused view) as a leading indicator of brand awareness rather than demanding immediate last-click CPAs 37. Overall, the blended CPA on TikTok across all sectors rose to $32.74 in early 2026. While the audience is clicking 13.74% more frequently year-over-year, downstream conversion friction remains a persistent platform challenge 21.
LinkedIn: The B2B Precision Premium
LinkedIn operates under a unique economic model: it possesses a fraction of Meta's user base (approximately 1.2 billion members) but commands unparalleled, deterministic first-party data regarding professional identity, corporate seniority, and organizational structure 4041. Consequently, it is undeniably the most expensive major ad platform in existence, yet it remains the most effective engine for B2B acquisition.
In 2026, the global average CTR for LinkedIn Sponsored Content sits between 0.44% and 0.65% 4243. Different formats yield different interactions; Single Image ads reach 0.56% CTR, while Document Ads (native PDFs) achieve 0.43% but dominate in lead capture efficiency 4243. CPCs reflect the extreme targeting precision, ranging from $5.58 to $15.00 globally 43. Targeting senior decision-makers natively inflates the CPC to averages above $6.40, while junior employees can be acquired for approximately $4.40 4243.
The average Cost Per Lead (CPL) via native Lead Gen Forms - which boast an exceptional 6.1% to 10% completion rate compared to the 2% average of external landing pages - ranges from $75 to $150 404344. However, in highly saturated sectors like Cybersecurity or Enterprise HR Tech, CPLs routinely scale up to $300 or $500 43. While a $400 CPA would bankrupt a B2C retailer, the economics of B2B enterprise sales completely justify the expense. Comprehensive 2026 benchmark reports indicate that LinkedIn is frequently the only paid social channel delivering a positive aggregate ROAS for B2B, averaging 113% (1.13x), with top performers reaching nearly 280% 4043. The exorbitant front-end costs act as a filtration mechanism; LinkedIn leads are deeply pre-qualified by professional attributes, resulting in significantly higher downstream sales close rates and healthy Lifetime Value to Customer Acquisition Cost (LTV:CAC) ratios ranging from 3:1 to 5:1 4143.
Google and YouTube: Search Dominance and Demand Gen
Google continues to dominate the intent-capture phase of the marketing funnel. As previously noted, Q1 2026 saw search ad CPCs climb 11% to reach an average of $1.10, though industries with massive customer lifetime values pay steep premiums; Legal Services command Google Search CPCs of $8.58, while Travel and Hospitality enjoy CPCs nearer to $2.12 945. The overall Search CTR remains highly robust at 6.66% 45.
Within Google's visual ecosystem, YouTube ad placements (now heavily consolidated under Demand Gen campaigns) provide highly efficient reach. The average YouTube CPM spans $5.00 to $10.00, and the Cost Per View (CPV) remains remarkably low at $0.02 to $0.03 274546. This positions YouTube as unparalleled infrastructure for top-of-funnel storytelling and brand recall 45.
Table 2: Master Cross-Platform Benchmark Comparison (Q1 2026 Actuals)
The following table synthesizes the median performance ranges across the primary digital platforms, explicitly segmented to highlight the extreme divergence between B2B and B2C unit economics. Projections carry inherent statistical margins of error and are highly sensitive to AOV and regional targeting.
| Platform | Core Audience / Strength | Avg. CPM (USD) | Avg. CPC (USD) | Avg. CTR (%) | Est. CPA / CPL Range (USD) | Median ROAS |
|---|---|---|---|---|---|---|
| Meta (FB/IG) | B2C Direct Response / Broad B2B | $11.54 - $14.19 1733 | $0.89 (B2C) - $2.94 (B2B) 32 | 1.49% - 2.19% 1733 | $23.10 - $30.00 (CPA) 34 | 2.79x (B2C) 1.62x (B2B) 32 |
| TikTok | B2C Gen Z / Millennial Discovery | $6.20 - $9.16 3638 | $0.44 - $1.00 3638 | 0.84% - 1.20% 3637 | $32.74 (Blended CPA) 21 | 2.21x (Overall) 21 |
| B2B Enterprise / High-Ticket SaaS | $31.00 - $45.00 4041 | $5.58 - $15.00 43 | 0.44% - 0.65% 4243 | $75.00 - $500.00+ (CPL) 4043 | 1.13x (113% B2B) 43 | |
| Google Search | High Intent Capture (All Sectors) | N/A (Intent-based) | $1.10 (Avg) to $8.58 (Legal) 945 | 6.66% (Search) 45 | Highly Variable based on product margin | N/A (Highly Variable) |
| YouTube | Broad Consumer / Educational | $5.00 - $10.00 27 | $0.49 (CPC) / $0.02 (CPV) 4546 | 0.65% 4546 | Variable (Assists focused) | N/A |
Data synthesized from established 2026 audit reports (Tinuiti, Skai, Merkle, Socialinsider) and platform-specific marketing science data.
Geographic Benchmark Diversity: APAC and EMEA Realities
Global digital marketing strategy cannot rely solely on North American (NAMER) benchmarks. Macro-economic factors, regulatory environments, smartphone penetration, and cultural platform adoption rates generate massive variances in media pricing. The CPM of a given market is intrinsically tied to its GDP per capita, digital maturity, and auction saturation 47.
The North American Baseline
The United States represents the most expensive and saturated digital advertising market globally. Strong consumer purchasing power and fierce advertiser competition drive Meta CPMs to extreme highs, ranging from $16.00 to $28.00 depending on placement, with Canada mirroring this premium environment ($11.00 to $18.00 CPM) 4748. However, the exorbitant costs are frequently justified by exceptional conversion rates and high Average Order Values; a $20 CPM in the US can still reliably deliver a 3x to 5x ROAS if product-market fit is established 48.
Asia-Pacific (APAC): The Fragmented Growth Engine
The APAC region remains the fastest-growing advertising market globally, projected to reach $376.4 billion in 2026 (a 5.4% year-over-year expansion) 3. However, treating APAC as a monolith is a critical error; it is an ecosystem of extreme contrasts.
- Tier 1 APAC (Australia): Functioning almost identically to Western markets, Australia features high consumer purchasing power and intense auction competition. Consequently, its Meta CPM averages $11.63, placing it firmly among the most expensive global markets 47. Australian digital marketing in 2026 requires a highly balanced approach to strict data privacy regulations and performance marketing efficiency 49.
- Tier 2 APAC (Japan, South Korea, Singapore): Markets like Japan ($6.73 CPM) and Singapore ($7.21 CPM) reflect highly mature, stabilized economies with premium traffic 47. However, cultural expectations dictate strategy. In Japan and Korea, digital marketing is less about aggressive rapid-conversion tactics and more focused on meticulous brand equity and content precision 49. Consumers in these markets possess lower tolerance for overtly commercial content, with platforms like LINE (Japan) and Kakao (Korea) dominating the messaging ecosystem 49. Interestingly, Kantar research notes that Japanese consumers rate Netflix ads as the most trustworthy and highest quality media format, a unique regional anomaly prioritizing premium video 22.
- Tier 3 APAC (India and Emerging Markets): India represents massive growth acceleration (+8.6% YoY in 2026), fueled heavily by mobile-first adoption and major sporting events like the IPL 3. Because per-capita purchasing power is lower, the ad inventory is highly affordable, with Meta CPMs plunging to between $1.36 and $2.60 4751. While India offers unparalleled scale for global user acquisition, advertisers must implement strict fraud-prevention protocols. Bot traffic can artificially inflate impressions by 20% to 30% in lower-cost regions, skewing engagement data 51. Furthermore, Southeast Asia (Indonesia, Vietnam) is entirely dominated by social commerce and live-streaming; consumers increasingly discover and purchase products directly through TikTok Shop, bypassing traditional search engines entirely 49.
Europe, Middle East, and Africa (EMEA): Maturity and Regulation
The European digital landscape is defined by high market saturation and the heaviest regulatory burdens in the world, resulting in unique behavioral benchmarks.
- Tier 1 EMEA (UK, Germany, France): The United Kingdom commands the highest Meta CPM in Europe at $11.81, followed by Germany at $9.05 and France at $8.05 4751. The high operational cost is offset by the immense purchasing power of these populations, making them highly profitable targets for established cross-border e-commerce brands 4751.
- B2B Engagement Drag and Market Saturation: European professionals are highly cynical and resistant to traditional advertising. On professional networks like LinkedIn, EMEA frequently underperforms global CTR averages (often falling below the 0.44% global benchmark) due to ad fatigue and a noisy feed 52. The median B2B buying cycle in Europe now extends to an arduous 211 days 52. To combat "click-and-wait" friction, where users abandon slow external landing pages, European B2B advertisers are seeing massive success with native LinkedIn Document Ads. These formats allow users to consume high-value industry reports directly in the feed, yielding astonishing lead form completion rates approaching 22.7% 52.
- Lifecycle and Retention Focus: Because acquiring net-new customers in Europe is expensive and highly regulated, brands over-index on retention channels. EMEA email marketing benchmarks reveal a robust 56.3% Open Rate and a 4.4% Click-Through Rate, significantly outperforming global averages 23. This indicates that European consumers, once acquired and properly opted-in, are highly receptive to ongoing brand communications, reinforcing the necessity of First-Party data strategies in the region 23.
Future Outlook: The Intelligence Imperative
As the industry advances deeper into 2026, the theoretical debates regarding AI and privacy have concluded. The market is no longer adopting new capabilities; it is being forced to operationalize them 1.
Marketing science journals predict that by the end of 2026, the collapse of traditional behavioral addressability will permanently shift digital advertising toward "neuro-contextual" approaches 2. Advertisers will no longer optimize around isolated demographic identifiers or legacy cookies. Instead, AI-powered contextual advertising will evolve into emotional understanding, aligning dynamic messaging with the real-time interest, sentiment, and intent of the user, irrespective of their tracked identity 2.
The smartest brands are not choosing between traditional marketing tools and AI; they are building hybrid technological stacks. They deploy agentic AI to manage the astronomical complexity of cross-channel bidding and dynamic creative variation at scale, driving down acquisition costs by up to 40% 30. Concurrently, they reserve human marketing talent for the tasks algorithms cannot execute: building brand trust, navigating complex regulatory compliance, and crafting the authentic emotional narratives required to close high-value sales 30. In the 2026 paradigm, the ultimate competitive advantage belongs not to the brand with the most sophisticated AI, but to the brand that feeds its AI the cleanest, privacy-compliant first-party data while maintaining a profoundly human connection with its audience.